Originally seen on Hot Air but is from the CO2 coalition.
By Gregory Wrightstone
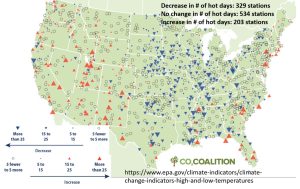
As reported by EPA, only 19% of all weather stations report an increase in the number of hot days since 1948!
Below is an important chart that somehow slipped by EPA’s “consensus” censorship squad. It is a map of all 1,066 weather stations across the United States. The change in the number of hot days for that station are ID’d as increasing (red), stayed the same (blank) or decreasing (blue).
A total of 863 stations, or 81%, reported either a decrease or no change in the number of hot days! Any guesses on how long this map will remain up on their site?
Gregory Wrightstone is a geologist; executive director of the CO2 Coalition, Arlington, VA; and author of Inconvenient Facts: The Science That Al Gore Doesn’t Want You to Know.
1 comment:
Back in the 70s in college I attended a course on Physical Geometry as one of my electives. It was about the earth, weather, how oil comes up, how temperatures changes through time, and how it is being measured.
I found temperatures was started to be measured in various spots in the world but usually at airports in the 1920s, and since then the areas have grown to be concrete megacomplex cities plus the measure is near jet blasts skewing the readings. Also many rural areas are not tested.
I learned that weather will change always and mostly based on volcanic issues affecting the weather and clouds that become very heavy affecting temps and causing severe weather around the world. This happened in 1815 with a volcano and then in 1880. In the Pacific Rim we are having volcanic activity now.
Post a Comment